Toll Free - 09582476178


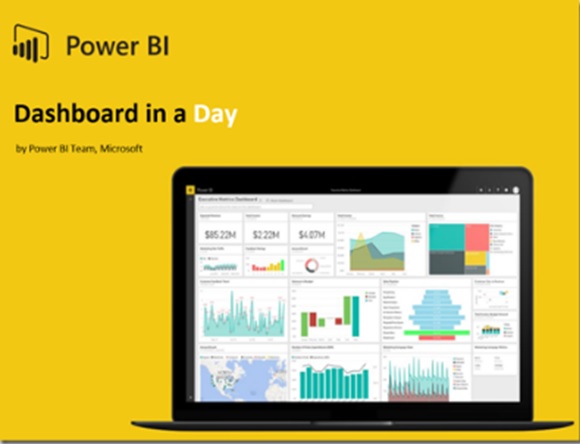
What is Power BI?
Power BI is a business analytics service by Microsoft. It is used to create insight of data within organization. Power BI is a collection of software services, apps and connectors that works together. Power BI takes information from different data source and turns them into meaningful custom visuals.
Learn Power BI?
Power BI is one of the most useful business platform. We can use this tool to create real time dashboard by using multiple sources which can be used by business to take appropriate decision.
Why Power BI?
There is multiple reason due to which we should use Power BI instead of Excel
- 1. Store of a Huge amount of data
- 2. Spot Data Trends can be created easily
- 3. Create Time Trend Analysis in Power BI
- 4. Ultimate UX Features
- 5. Awesome Cloud Based Features
Microsoft Power BI Course Outline
Introduction to Power BI
- • What is Power BI?
- • The Power BI service
- • Power BI Report Server
- • Power BI Desktop
- • Reports and Dashboards
- • Datasets
- • Row-Level Security
- • Content Packs
- • Natural Language Queries
Data Sources
-
• Connecting to Files
- • Importing Excel Files
- • Publishing to Power BI from Excel
- • Updating Files in Power BI
- • Data Refresh
- • The Power BI Data Model
- • Managing Data Relationships
- • Optimising the Model for Reporting
- • Hierarchies
- • SQL Servers
- • Other Data Sources
- • R Script Data Connector
- • Configuring Data for Q&A
- • Creating Content Packs
- • Creating a Group
Shaping and Combining Data
- • The Query Editor
- • Applied Steps
- • Advanced Editor
- • Shaping Data
- • Formatting Data
- • Transforming Data
- • Combining Data
- • Merging Data
Modelling Data
- • What are the Relationships?
- • Viewing Relationships
- • Creating Relationships
- • Cardinality
- • Cross Filter Direction
- • What is DAX?
- • Syntax
- • Functions
- • Context
- • Calculated Columns
- • Calculated Tables
- • Measures
Interactive Data Visualisations
- • Power BI Reports: Page Layout and Formatting
- • Multiple Visualisations
- • Creating Charts
- • Using Geographic Data
- • Histograms
- • Power BI Admin Portal
- • Service Settings
- • Desktop Settings
- • Dashboard and Report Settings